Energy Monitoring in Home Assistant: Local API, not Cloud
My Energy Dashboard looked fine for months — until I started taking it seriously. Then I noticed the holes. Whole hours missing, individual loads dropping to zero overnight and coming back with an absurdly high value. The cause wasn’t Home Assistant. It was where the readings came from: a vendor cloud.
The numbers I actually rely on today come from a local source: my NEOOM system exposes a local REST API on my own network. No login against somebody else’s server, no rate limits, no internet requirement. That is the real distinction — not the brand, but the question: who answers when Home Assistant asks?
The real problem: cloud meters aren’t meters
A Tuya device in Home Assistant looks like a local device. It isn’t. The
entity arrives through the tuya integration, and that integration talks
to the manufacturer’s data center — not to the plug in your hallway. I have
a portable air conditioner sitting in HA exactly like that, as
climate.portable_air_conditioner, platform tuya, every value routed
through the cloud.
For a switch that’s annoying but survivable. For energy it’s fatal, because the HA Energy Dashboard needs a monotonically increasing kWh counter. Every dropout either leaves a gap or — worse — looks like a meter reset, which HA happily renders as a massive consumption spike.
That same air conditioner is what taught me how real the latency is. Send
hvac_mode, temperature and fan_mode in quick succession and HA
briefly shows cool — then the device reports back off. The only thing
that fixed it was spacing the calls out:
action:
  - service: climate.set_hvac_mode
    target:
      entity_id: climate.portable_air_conditioner
    data:
      hvac_mode: cool

  - delay: "00:00:05"

  - service: climate.set_temperature
    target:
      entity_id: climate.portable_air_conditioner
    data:
      temperature: 20
A five-second delay, because the cloud round trip can’t cope otherwise. Five seconds, to switch on a device that is standing in my own house. That’s the moment you realize you’re not automating your house — you’re automating somebody else’s server. And if a simple switch command needs a five-second buffer, you definitely don’t want to collect meter readings over the same path.
Cloud vs. local — the honest comparison
| Criterion | Vendor cloud (e.g. Tuya) | Local API on your LAN |
|---|---|---|
| Reliability | Depends on internet + vendor uptime | Keeps working offline |
| Latency | 0.5–3 s, variable | 50–200 ms, consistent |
| Privacy | Your load profile leaves the house | Data stays on the LAN |
| Counter quality | Gaps on every outage | Gap-free while HA runs |
| Survives vendor shutdown | No | Yes |
| Rate limits / API quotas | Can happen any time | Not applicable |
That second-to-last row is the one nobody puts on the box. A cloud integration is a loan. If the vendor changes API terms, introduces quotas, or shuts the service down, your devices go quiet — and your Energy Dashboard history ends on that exact day. A meter that has to ask somebody else’s data center for its own reading isn’t a meter. It’s a subscription.
Pulling NEOOM into Home Assistant over the local API
My system serves the complete energy flow as JSON from an endpoint on the local network:
http://<neoom-ip>/api/v1/site/state<neoom-ip> is your own system’s address on your LAN — mine sits on a
fixed address in the 192.168 range. Substitute yours, and pin it in the
router while you’re at it, otherwise the integration points at nothing
after the next DHCP lease.
The response contains a list of state objects under energyFlow.states[]
with readable keys — among them POWER_GRID, POWER_PRODUCTION,
POWER_CONSUMPTION_CALC and STATE_OF_CHARGE, plus the cumulative energy
totals.
The trick that keeps this clean and gentle on the device: one REST sensor fetches the whole block and stores it as a JSON attribute. Everything else is template sensors reading out of that attribute. One HTTP request per interval, as many entities as you like.
I keep the whole integration in a package file,
/config/packages/neoom.yaml. That keeps configuration.yaml tidy and
lets you version the thing as a single unit:
# /config/packages/neoom.yaml
rest:
  - resource: "http://<neoom-ip>/api/v1/site/state"
    scan_interval: 30
    sensor:
      - name: "neoom_raw_state"
        value_template: "{{ value_json.energyFlow.states | length }}"
        json_attributes_path: "$.energyFlow"
        json_attributes:
          - states

template:
  - sensor:
      - name: "neoom Power Production"
        unique_id: neoom_power_production
        unit_of_measurement: "W"
        device_class: power
        state_class: measurement
        state: >
          {{ state_attr('sensor.neoom_raw_state', 'states')
             | selectattr('key', 'eq', 'POWER_PRODUCTION')
             | map(attribute='value') | first | float(0) }}

      - name: "neoom Power Grid"
        unique_id: neoom_power_grid
        unit_of_measurement: "W"
        device_class: power
        state_class: measurement
        state: >
          {{ state_attr('sensor.neoom_raw_state', 'states')
             | selectattr('key', 'eq', 'POWER_GRID')
             | map(attribute='value') | first | float(0) }}

      - name: "neoom Power Consumption"
        unique_id: neoom_power_consumption
        unit_of_measurement: "W"
        device_class: power
        state_class: measurement
        state: >
          {{ state_attr('sensor.neoom_raw_state', 'states')
             | selectattr('key', 'eq', 'POWER_CONSUMPTION_CALC')
             | map(attribute='value') | first | float(0) }}

      - name: "neoom Battery SOC"
        unique_id: neoom_battery_soc
        unit_of_measurement: "%"
        device_class: battery
        state_class: measurement
        state: >
          {{ state_attr('sensor.neoom_raw_state', 'states')
             | selectattr('key', 'eq', 'STATE_OF_CHARGE')
             | map(attribute='value') | first | float(0) }}
The cumulative counters follow the same pattern, but they need the two
lines almost everyone gets wrong — device_class: energy and
state_class: total_increasing:
template:
  - sensor:
      - name: "neoom Energy Imported"
        unique_id: neoom_energy_imported
        unit_of_measurement: "kWh"
        device_class: energy
        state_class: total_increasing
        state: >
          {{ state_attr('sensor.neoom_raw_state', 'states')
             | selectattr('key', 'eq', 'ENERGY_IMPORTED')
             | map(attribute='value') | first | float(0) }}
I run the same block for neoom_energy_exported, neoom_energy_produced,
neoom_energy_charged and neoom_energy_discharged. One thing matters
before you copy any of this: open the raw JSON yourself. Call the URL
in a browser and check which keys your system actually returns and in
which unit — watts versus kilowatts is a factor-1000 error in the
dashboard. Then verify the templates under Developer Tools → Template.
Energy Dashboard mapping
Under Settings → Dashboards → Energy, my mapping looks like this:
| Energy Dashboard field | Entity |
|---|---|
| Grid consumption | sensor.neoom_energy_imported |
| Return to grid | sensor.neoom_energy_exported |
| Solar production | sensor.neoom_energy_produced |
| Battery charged | sensor.neoom_energy_charged |
| Battery discharged | sensor.neoom_energy_discharged |
That’s all it takes. If an entity doesn’t show up in the picker, it’s
almost always a missing state_class: total_increasing or a unit that
isn’t kWh.
Here’s what that looks like on my setup — an ordinary summer day, every value coming from the local API:
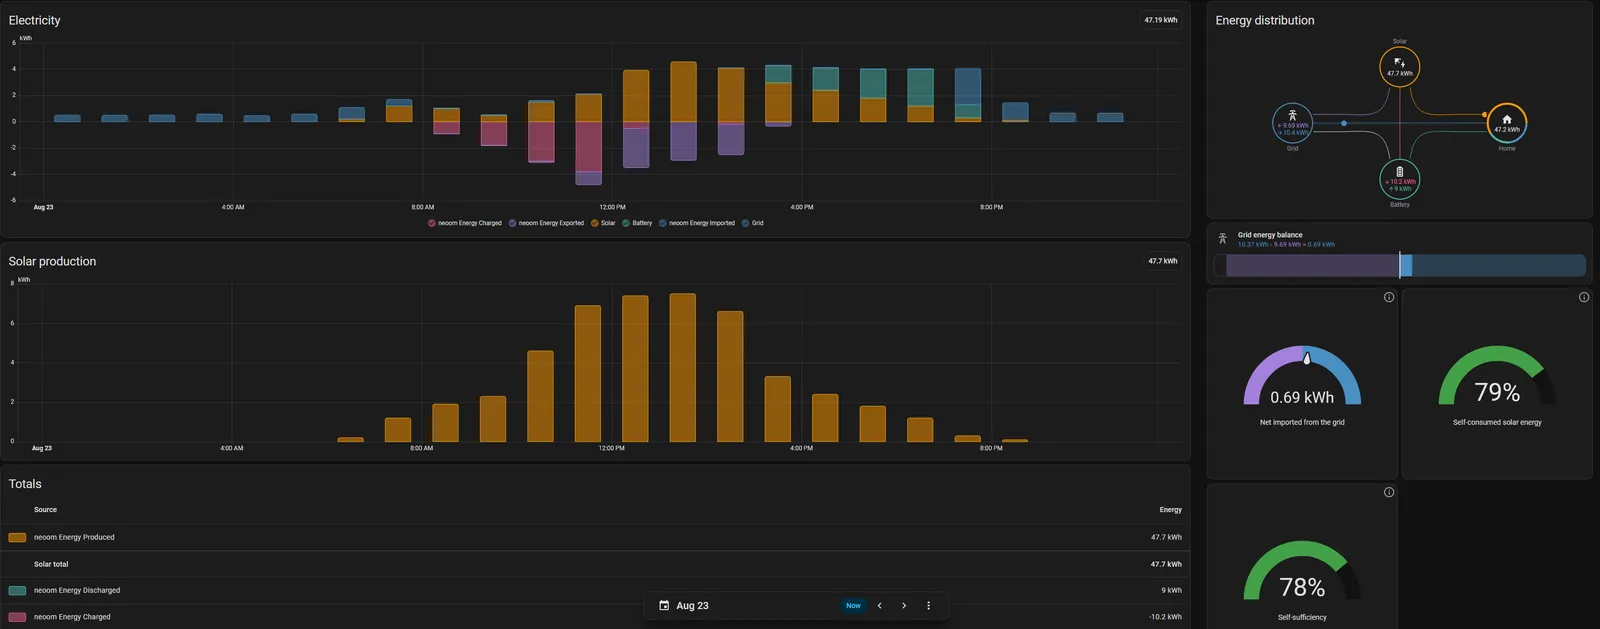
neoom Energy Produced, Imported, Exported, Charged and Discharged.The interesting part isn’t the total in the corner, it’s the shape of the
series: the bars are continuous. That was never true with the cloud
values — entire hours were simply missing. You can also read the battery
pattern straight off the chart: it charges around midday (pink, below the
zero line) and feeds back in the evening (teal). Without clean
total_increasing counters, that’s exactly the rendering that falls apart.
Staying honest: local doesn’t mean vendor-independent
A local API is far more robust than a cloud — but it is still a vendor-specific interface. Field names, structure or units can change with a firmware update, and nobody emails you about it. My habit: after every update, call the raw URL once and check the keys still line up. The advantage over the cloud holds anyway — when something changes here, it changes at a moment you triggered, not the vendor.
If you want per-load measurement
NEOOM measures at the house connection, not at the washing machine. If you need per-circuit or per-socket metering and you don’t have an energy management system, the usual answer is a metering plug or a small metering relay; Shelly devices are the common choice here because they ship an open local API and the cloud can be switched off. That’s a general recommendation, not a description of my own setup.
If you go that route, one thing matters more than the wiring diagram:
Warning: In-wall metering relays are hard-wired to 230 V mains. Working on fixed mains installations is potentially lethal. In Germany, Austria and Switzerland, work on the fixed installation is generally reserved for a qualified electrician — doing it yourself can also void your insurance cover. If you are not an electrician: have it done, or use the plug-in option instead.
A plug-in metering adapter is the safe alternative: plug it in, done, zero electrical work. If the device reports watts but no kWh, build the counter in HA yourself:
sensor:
  - platform: integration
    source: sensor.washing_machine_power
    name: washing_machine_kwh
    unit_prefix: k
    unit_time: h
    method: left

utility_meter:
  washing_machine_daily:
    source: sensor.washing_machine_kwh
    cycle: daily
Running Tuya devices locally (LocalTuya)
Do you have to throw out your Tuya plugs? No. LocalTuya is a custom integration you install through HACS; it talks to the device directly on your LAN, bypassing the cloud.
- Install HACS if you haven’t already.
- Search for LocalTuya in HACS, install it, restart HA.
- Fetch the Device ID and Local Key once from the Tuya IoT platform — the unpleasant part (a developer account, so you’re allowed to talk to your own plug), but you only do it once.
- Add the devices in LocalTuya and map the data points (DPs) for power and energy.
Two things I learned the hard way: the Local Key changes if you re-pair the device with the vendor app, so leave the app alone after setup. And HACS integrations can throw warnings after HA updates — a deprecation message in the log is a nudge to the developer, not a broken device. Everything keeps working.
What does NOT help
- Shortening the cloud integration’s scan interval. You don’t get better data, you just hit a rate limit faster.
- Buying more plugs from the same cloud brand. That scales the problem, not the solution.
- Using
state_class: measurementfor a kWh counter. Wrong — that’s an instantaneous value, not a counter, and the dashboard will reject it. - Feeding watt sensors straight into the Energy Dashboard. Not possible;
you need the
integrationplatform shown above. - Creating one REST sensor per value. That multiplies requests against the same box. One raw sensor plus templates is enough.
- Papering over gaps with an
availability_template. That hides the outage, it doesn’t fix it. - Merging everything through a cloud bridge service. You’ve traded one dependency for two.
Where I landed
Everything I want to analyze long term — grid import, export, PV production, battery — now comes from the local NEOOM API. What’s left on the cloud is the air conditioner: a device where a five-second delay is irrelevant and whose history I don’t need. That’s the dividing line I’d recommend:
If you want the value to still be in the chart a year from now, it has to be measured locally. Everything else is borrowed.